SCREENER +
Dashboard & Screener
The covered CEF and high-income ETF universe, your watchlist, gainers, losers, and heatmap. Filter by type, risk level, yield, frequency, discount, or payment record.
The fund universe, seven-check research, payment records, and corporate events.
Your holdings, trades, working capital, income tracker, risk mix, and projections.
Together in a workspace built around how you invest.
Full Complete access during your trial. Card required at checkout.
Cancel before the trial ends to pay nothing.
01 / DASHBOARD & SCREENER
A quick glimpse: five sample funds, a few key figures, and your watchlist. Explore the full dashboard in your workspace.
Simplified product views using CEF Complete’s own layouts and styles. All figures, ratings, dates, and account records in the tour are illustrative. Distribution rate is not total return.
THE TOOLS INSIDE CEF COMPLETE
Ten tools under one roof, each with one job in your income routine: find the funds, check their record, then follow what your own money pays you.
The covered CEF and high-income ETF universe, your watchlist, gainers, losers, and heatmap. Filter by type, risk level, yield, frequency, discount, or payment record.
Lookup, compare, browse, and watchlist. Seven checklist checks with evidence, payment history and changes, NAV and total return, distribution composition, holdings, leverage, and a printable survey.
Fund-specific news and distribution changes beside mergers, tender offers, rights offerings, liquidations, conversions, and delistings. Follow the whole universe or your saved funds.
Holdings, working capital, account value, cash, cost basis, position income, allocation, and your chosen profit-taking targets. Enter positions, import broker files, or use a supported read-only connection.
Base income, profit taken, working capital, monthly return, cumulative totals, payments received, charts, and tax estimates. Keep dividends separate from realized profits and review what your accounts actually paid.
Starting capital, income yield, profit-taking, distributions and gains withdrawn, monthly contributions, and years. Compare working capital, cash withdrawn, and income taken out year by year.
Record buys and sells, match purchases to sales, review realized gains, and track your own target by purchase or fund. Target alerts appear in the app’s notifications when a holding reaches your target.
See CEF risk levels 1–7 and your portfolio mix against the goal you set. Review allocations and position sizes alongside the methodology. High-income ETFs are kept separate and unrated.
Add supported CEFs or ETFs you follow outside the covered universe. They are labeled “Not in the universe” in your research, watchlist, and holdings, and carry no universe risk level or checklist score.
A consistent way to look at risk. CEF research uses a seven-check framework and risk levels 1–7, with supporting evidence. High-income ETFs are a separate, unrated category. The full methodology and portfolio risk mix are included with Complete.
ONE-STOP SHOP MEANS ONE CONNECTED WORKFLOW
Most income investors juggle six websites and a spreadsheet to answer one question about a fund. Here it is one place: the fund’s record, its news and your own income, side by side.
Research the fund.
Understand the income.
Dashboard→Screener→Research→News & events
Portfolio→Trades→Income tracker→Risk mix→Projection
Payment records, NAV and total return, holdings, distribution composition, corporate events, and your own monthly income. Ask Complete when you need a term or figure explained.
Choose the tools you needA LITTLE HELP, RIGHT WHEN YOU NEED IT
Your CEF helper explains the figures in plain words. Ask about a fund’s payments, its discount, or what a term means. Choose whether to include your holdings for more context.

RETIREMENT MONEY SECRETS · STEVE SELENGUT
New to RMS? Start with Steve Selengut’s book and explore the income-investing community. CEF Complete gives you a workspace to organize your fund research and follow your own income.
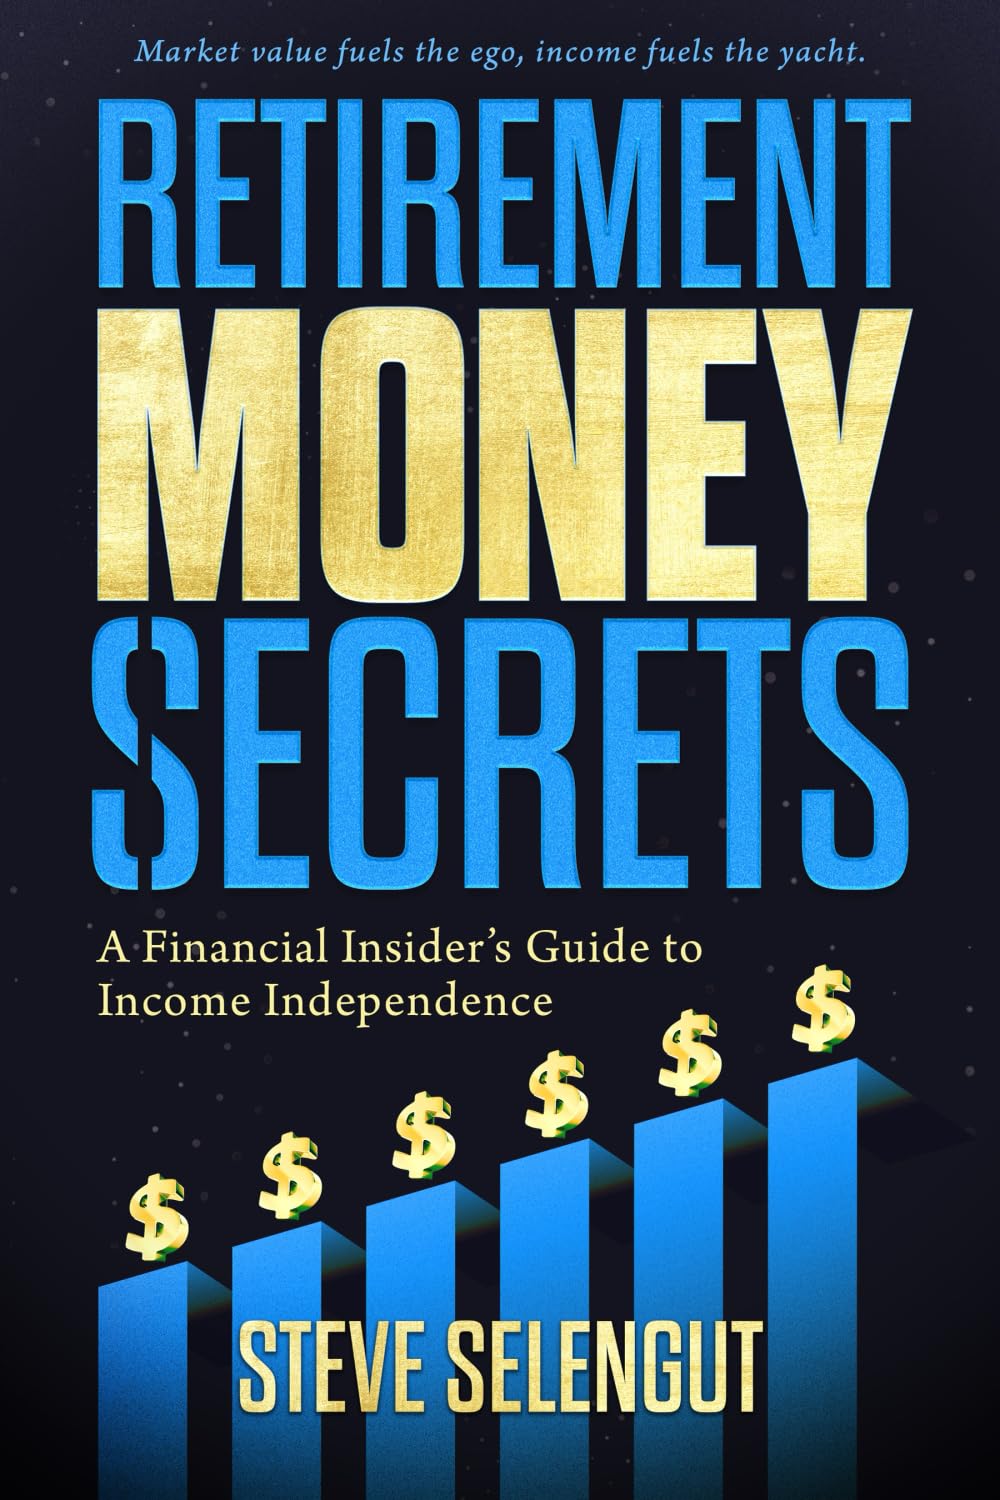
THE BOOK
Explore Steve’s approach to income investing, working capital, and the role of Closed-End Funds in an income-focused portfolio.
Find the book on Amazon Read the description and choose your format on Amazon.THE COMMUNITY
Explore the RMS Income Investing Community, led by Steve Selengut. Bring your questions and learn alongside people exploring the same income-focused ideas.
Use the Complete workspace: research, portfolio, income tracker, trades, risk mix, projections, exports, and Ask Complete.
Card required at checkout. Cancel before your trial ends to pay nothing.MAKE YOURSELF AT HOME
You don’t need to bring a spreadsheet or connect a brokerage to start exploring.
It takes a minute. Look around free with no card, or pick a plan and start its free trial at checkout.
Browse the universe, save a watchlist, and explore the tools in your plan.
With Complete, add holdings manually, upload broker files, or connect a supported account.
Broker files are read in your browser. Supported connections are read-only; CEF Complete never places trades or holds your funds.
FOUNDING MEMBER PRICING
Complete is free for two weeks. Screener and Research are free for one.
RMS group · Try Complete free for 2 weeksMake a free account and see six funds in full, in the app itself. No card, nothing to cancel. Pick a plan whenever you’re ready.
All prices in USD. Card required at checkout. Your chosen plan renews automatically after the trial unless you cancel. Cancel before your trial ends to pay nothing; cancel later to keep access through your paid period. Subscription terms ↗
CEF Complete brings the Closed-End Funds and high-income ETFs it covers into one workspace. Screener includes the dashboard and watchlist; Research adds fund records, comparisons, news, and corporate events. Complete adds your portfolio, income tools, projections, risk mix, exports, and Ask Complete.
Create an account, choose a plan, and enter your card at checkout. Complete is free for 2 weeks; Screener and Research are free for 1 week. Your card is charged when the trial ends unless you cancel first. The trial begins at checkout.
Yes. Make a free account and you can see six funds in full, in the app itself, with no card and nothing to cancel. When you want the whole universe and your own tools, choose a plan and start its free trial.
No. You can explore research without a connected account. On Complete, you can enter holdings yourself, import supported broker files, or use an available read-only connection. Files are read in your browser. CEF Complete never places trades or holds your investments.
CEF Complete provides research and education, not personalized investment advice or buy, sell, or hold recommendations. Risk levels and checklists organize information; they do not guarantee safety or returns. Ask Complete can explain the data and terminology but cannot predict prices or future payments.
You can move up a plan and manage or cancel your subscription through your account’s billing options. Cancel before your free trial ends to pay nothing. After a paid period begins, cancellation leaves access in place through the end of that period.
NAV is the value of a fund’s assets minus its liabilities, divided by shares outstanding. CEF shares can trade at a discount or premium to NAV. Distributions move cash from the fund to shareholders, so review NAV alongside total return and the payment record. Distribution composition shows income and realized gains. The research record brings these measures together.
The member workspace shows data freshness and flags delays. Prices, fund records, filings, and news update on different schedules. Third-party data can be delayed, incomplete, or incorrect, so verify important information with the fund’s filings and your broker. The simplified tool previews on this page use made-up figures, ratings, dates, and example records. They do not show current market information or your accounts.
WELCOME TO A CLEARER PICTURE
Come look around. Start with 14 days of Complete.
Try Complete free for 2 weeks Card required. Cancel before the trial ends to pay nothing.Or look around free, no card